

Year 2
Science Support Materials
Science snapshot: Animal Safari Data
Science/Science Inquiry Skills/Processing and analysing data and information
| Content Description | Relevant aspects of the Achievement Standards |
|---|---|
Use a range of methods to sort information, including drawings and provided tables (ACSIS040) | Students use informal measurements to make and compare observations. They follow instructions to record and represent their observations and communicate their ideas to others. |
Nature of the assessment
Teacher observation
Purpose of the assessment
To ascertain students' ability to interpret tally charts and column graphs
Stage in the teaching sequence
Within a teaching cycle on sorting data
Assessment task
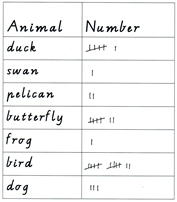
- While on an 'animal safari' to the local wetlands students worked in pairs to keep a tally of the animals they saw.
- The teacher selected two tally charts that had different tallies, based on the students' observations. He modelled drawing a column graph for each.
Observation
The teacher walked around the classroom to identify the students who could or could not explain what she had done wrong. She then led a class discussion specifically choosing students, about whom she had concerns, to answer questions focused on the need for a common unit.
Using the information
Although the teacher was not able to assess all students' understandings, he ascertained that many understood how a column graph was constructed from the tally sheet and could make simple interpretations of the graph. This allowed him to refine his next lesson.